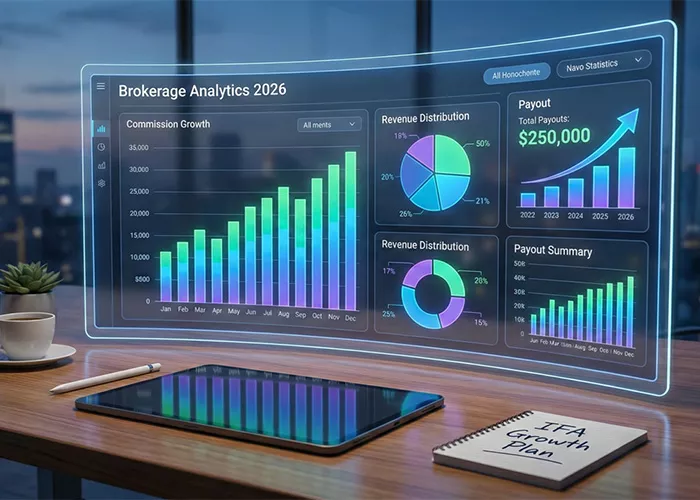
In 2026, successful MFDs and IFAs rely on the best mutual fund software for IFA in India to gain complete visibility over brokerage and payouts. Advanced brokerage analytics dashboards replace manual reports, reduce errors, and help distributors scale their business with full control.
How Mutual Fund Software Helps in Complete Brokerage Analysis?
Every Mutual Fund Distributor starts with the same goal, to build trust, grow AUM, and earn stable brokerage. However, as business grows, complexity increases. Brokerage comes from multiple sources. Sub-brokers need payouts. Reports are scattered. Calculations take time.
This is where the top mutual fund software For IFA in India becomes less of a “tool” and more of a business foundation. Helping distributors move from reactive work to proactive planning.
Without proper systems, MFDs often spend more time calculating brokerage than actually growing their business.
-
Brokerage Analytics Dashboard
A brokerage analytics dashboard gives MFDs a complete view of their brokerage business on a single, easy-to-read screen. Instead of managing multiple Excel files and manual calculations, distributors can instantly understand how their business is performing.
With one dashboard, MFDs can clearly see:
- Total brokerage earned
- Total payout given to sub-brokers
- Net income after payouts
Earlier, tracking brokerage meant opening several reports, matching figures, and double-checking numbers, often leading to errors and delays.
Key benefits of a single brokerage dashboard:
- Centralised brokerage visibility in one place
- Clean visual charts instead of raw data tables
- Faster monthly and quarterly reviews
- Trend analysis of brokerage, payouts, and net income over time
When brokerage data is presented clearly and visually, MFDs can make quicker, more confident decisions - focusing on growth rather than calculations.
-
Brokerage Periods Reports
Modern software allows MFDs to analyse brokerage for:
- A specific month
- A full quarter
- Any custom date range
This flexibility helps distributors compare performance across time periods and identify growth patterns without doing extra work.
-
Quick Financial Summary
At the top of a brokerage dashboard, MFDs see three key figures:
- Total Brokerage: Gross income generated
- Total Payout: Amount paid to sub-brokers
- Net Brokerage: Actual earnings after payouts
These three numbers give instant clarity on profitability, helping MFDs plan expenses, expansion, and future hiring.
-
AUM vs Brokerage Comparison
Many MFDs track AUM but ignore brokerage efficiency.
AUM vs brokerage comparison helps you understand:
- How effectively AUM converts into income
- Whether growth is profitable or just volumetric
- Which periods delivered better yield
This insight is critical for long-term business sustainability.
-
Identifying Top Sub-brokers
Not all clients contribute equally to brokerage.
With proper analytics, MFDs can clearly see:
- Which clients generate the highest brokerage
- Where relationship focus is needed
- Which segments are driving revenue
This allows smarter time allocation and better service planning.
-
Sub-Broker Payout Management
Earlier, payouts were calculated manually and shared individually.
Now, MFDs can:
- Generate payout reports automatically
- Share them directly on the sub-broker desk
- Handle multiple sub-brokers at once
Sub-brokers can view payout reports filtered by:
- AMC-wise
- Scheme-wise
- Client-wise
- Asset-wise
- Transaction-wise
This reduces follow-up calls and builds trust within the distribution network.
-
Multiple Rate Card Categories for Sub-brokers & History
Different sub-brokers often have different payout structures.
Modern systems allow MFDs to:
- Create multiple rate card categories
- Assign sub-brokers across categories
- Maintain payout accuracy automatically
- And rate card history provides a clear timeline of when categories were created and which sub-brokers were mapped or unmapped.
-
Clear Brokerage After GST
Accurate accounting is critical for compliance and clarity.
Updated brokerage reports now show:
- Brokerage amount after GST
- Transaction-wise clarity
- Easier reconciliation
This reduces accounting errors and improves financial discipline.
-
Automated Brokerage File Uploads
Manual brokerage file uploads are time-consuming.
Automation now allows:
- Scheduled file uploads
- Reduced manual effort
- Faster reconciliation
This gives MFDs more time to focus on clients and growth.
Why 2026 Belongs to Data-Driven MFDs
In 2026, growth will belong to distributors who:
- Understand their numbers
- Control payouts effectively
- Use analytics to plan ahead
Those relying on manual processes will struggle to scale.
Conclusion:
For MFDs and IFAs, brokerage is not just income, it is the pulse of the business.
When brokerage data is clear, visual, and automated, decisions are improved, growth becomes predictable and stress is reduced. The right mutual fund software transforms brokerage management from a headache into a strategic advantage.